TRACES
Log everything for production monitoring and debugging
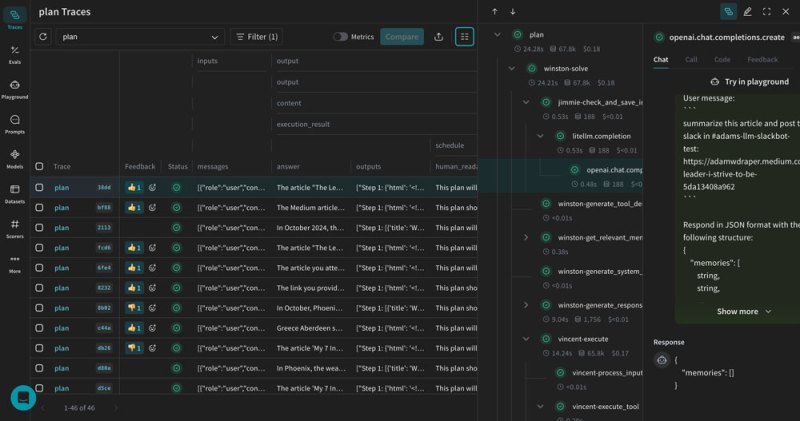
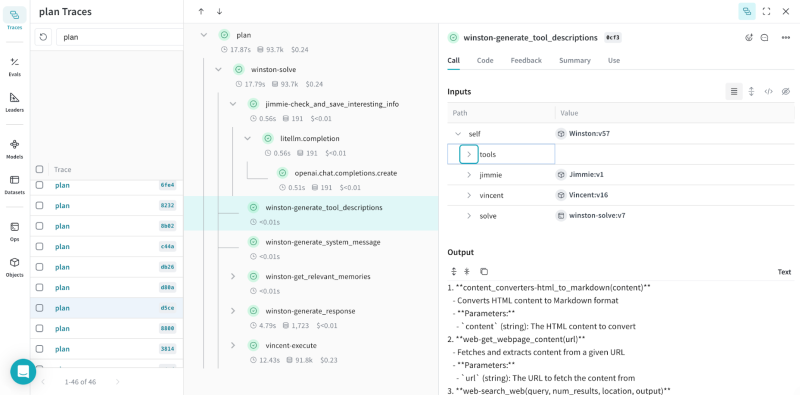
Weave automatically logs all inputs, outputs, code, and metadata in your application at a granular level, organizing the data so you can easily visualize traces of your LLM calls. Using these traces, you can debug issues during development and monitor your agents and AI applications when they are deployed in production.
Trace trees
Weave organizes logs from various levels of the call stack into a trace tree, which you can use to quickly detect, analyze, and solve issues. Metrics such as latency and cost are automatically aggregated at every level of the tree, making it easy to pinpoint root causes of problems.
Production monitoring
Monitor live traces from your application in production to identify edge cases missed during evaluation and testing. Continuously improve your application’s quality and performance. Use online evals (preview) to score live, incoming traces for monitoring without impacting the production environment.


Log OpenTelemetry traces
Collecting OpenTelemetry data? Send it straight to Weave—no extra instrumentation required. And you’re no longer limited to Python or JavaScript, because now you can log traces from any backend language supported by OpenTelemetry.
Multimodality
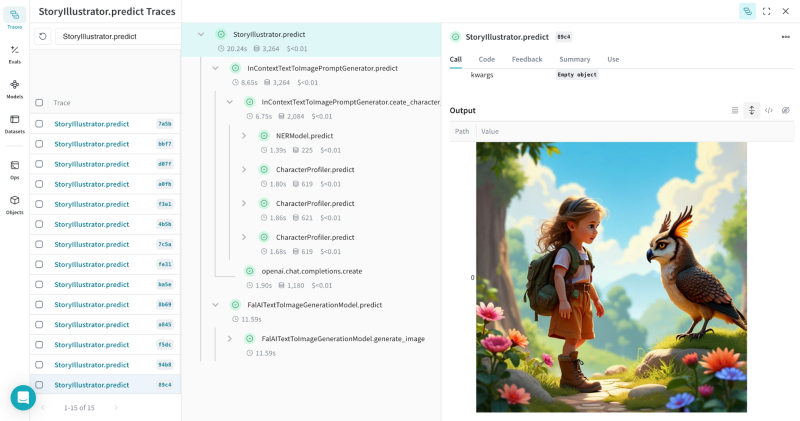
Weave logs text, datasets, code, images, and audio with support for video and other modalities coming soon.

Built for long text
Weave is built from the ground up for LLM applications. It makes it easy to visualize and examine large strings like documents and code in traces. When you click on a cell, a popout launches where you can change the display format—you can choose text, markdown, or code.
Integrated chat view
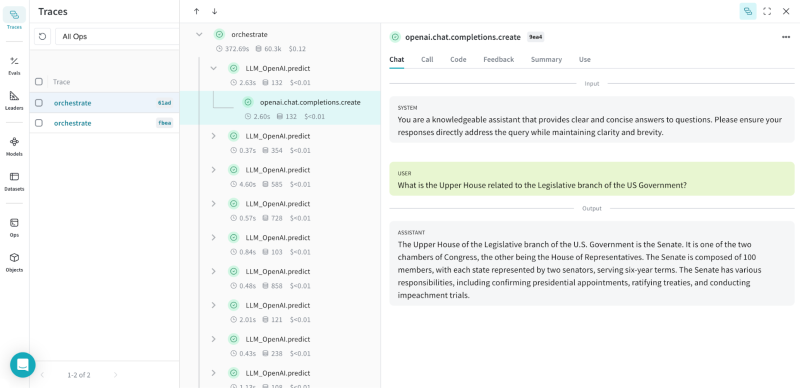
When analyzing LLM responses, you can use the chat view to visualize user requests, system prompts, and LLM outputs for a given conversation thread.

Capture user feedback
To thoroughly test AI applications, you need real-world end-user feedback. When you incorporate a feedback mechanism into your application, Weave logs this user feedback as well. This helps you combine calculated scores with user input for a more holistic evaluation of your application’s performance.
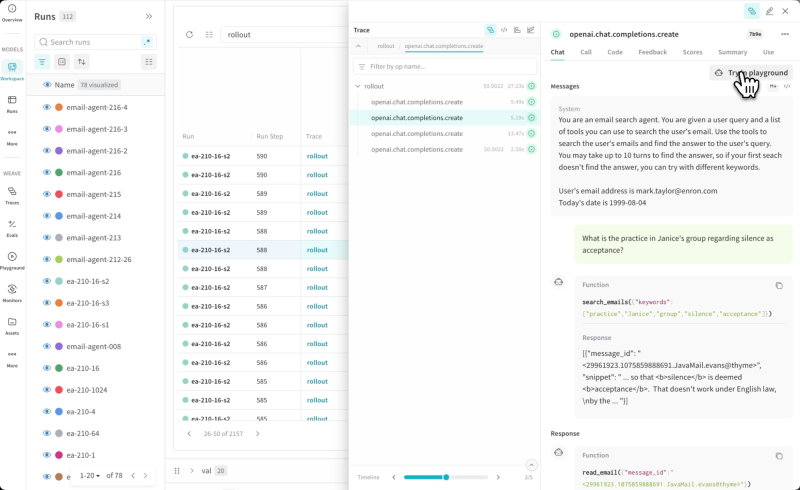
RL fine-tuning to ship better agents, faster
Weave Traces is a panel you can add to your training workflow in W&B Models to inspect detailed agent trajectories at every step of an RL fine-tuning run. Correlate metrics with rollouts to diagnose issues quickly and ship agentic models with higher accuracy, better performance, and lower cost. Weave is pre-integrated with popular RL frameworks and auto-logs traces alongside your metrics during fine-tuning, giving you full visibility with minimal setup.
Get started with tracing
Explore Weights & Biases
Learn more about Weave
The Weights & Biases platform helps you streamline your workflow from end to end
Models
Experiments
Track and visualize your ML experiments
Sweeps
Optimize your hyperparameters
Registry
Publish and share your ML models and datasets
Automations
Trigger workflows automatically
Weave
Traces
Explore and
debug LLMs
Evaluations
Rigorous evaluations of GenAI applications