Track, compare, and visualize your ML models with 5 lines of code
Quickly and easily implement experiment logging by adding just a few lines to your script and start logging results. Our lightweight integration works with any Python script.
					import wandb

# 1. Start a W&B run
run = wandb.init(project="my_first_project")

# 2. Save model inputs and hyperparameters
config = wandb.config
config.learning_rate = 0.01

# 3. Log metrics to visualize performance over time
for i in range(10):
 run.log({"loss": 2**-i})
					import weave
from langchain_core.prompts import PromptTemplate
from langchain_openai import ChatOpenAI

# Initialize Weave with your project name
weave.init("langchain_demo")

llm = ChatOpenAI()
prompt = PromptTemplate.from_template("1 + {number} = ")

llm_chain = prompt | llm

output = llm_chain.invoke({"number": 2})

print(output)
					import weave
from llama_index.core.chat_engine import SimpleChatEngine

# Initialize Weave with your project name
weave.init("llamaindex_demo")

chat_engine = SimpleChatEngine.from_defaults()
response = chat_engine.chat(
    "Say something profound and romantic about fourth of July"
)
print(response)
					import wandb
# 1. Start a new run
run = wandb.init(project="gpt5")
# 2. Save model inputs and hyperparameters
config = run.config
config.dropout = 0.01
# 3. Log gradients and model parameters
run.watch(model)
for batch_idx, (data, target) in enumerate(train_loader):
...
   if batch_idx % args.log_interval == 0:
   # 4. Log metrics to visualize performance
      run.log({"loss": loss})
import wandb
# 1. Define which wandb project to log to and name your run
run = wandb.init(project="gpt-5",
run_name="gpt-5-base-high-lr")
# 2. Add wandb in your `TrainingArguments`
args = TrainingArguments(..., report_to="wandb")
# 3. W&B logging will begin automatically when your start training your Trainer
trainer = Trainer(..., args=args)
trainer.train()
					from lightning.pytorch.loggers import WandbLogger

# initialise the logger
wandb_logger = WandbLogger(project="llama-4-fine-tune")

# add configs such as batch size etc to the wandb config
wandb_logger.experiment.config["batch_size"] = batch_size

# pass wandb_logger to the Trainer
trainer = Trainer(..., logger=wandb_logger)

# train the model
trainer.fit(...)
import wandb
# 1. Start a new run
run = wandb.init(project="gpt4")
# 2. Save model inputs and hyperparameters
config = wandb.config
config.learning_rate = 0.01
# Model training here
# 3. Log metrics to visualize performance over time
with tf.Session() as sess:
# ...
wandb.tensorflow.log(tf.summary.merge_all())
import wandb
from wandb.keras import (
WandbMetricsLogger,
WandbModelCheckpoint,
)
# 1. Start a new run
run = wandb.init(project="gpt-4")
# 2. Save model inputs and hyperparameters
config = wandb.config
config.learning_rate = 0.01
... # Define a model
# 3. Log layer dimensions and metrics
wandb_callbacks = [
WandbMetricsLogger(log_freq=5),
WandbModelCheckpoint("models"),
]
model.fit(
X_train, y_train, validation_data=(X_test, y_test),
callbacks=wandb_callbacks,
)
import wandb
wandb.init(project="visualize-sklearn")
# Model training here
# Log classifier visualizations
wandb.sklearn.plot_classifier(clf, X_train, X_test, y_train, y_test, y_pred, y_probas, labels,
model_name="SVC", feature_names=None)
# Log regression visualizations
wandb.sklearn.plot_regressor(reg, X_train, X_test, y_train, y_test, model_name="Ridge")
# Log clustering visualizations
wandb.sklearn.plot_clusterer(kmeans, X_train, cluster_labels, labels=None, model_name="KMeans")
import wandb
from wandb.xgboost import wandb_callback
# 1. Start a new run
run = wandb.init(project="visualize-models")
# 2. Add the callback
bst = xgboost.train(param, xg_train, num_round, watchlist, callbacks=[wandb_callback()])
# Get predictions
pred = bst.predict(xg_test)

Visualize and compare every experiment
Quickly find and re-run previous model checkpoints
Weights & Biases’ experiment tracking saves everything you need to reproduce models later— the latest git commit, hyperparameters, model weights, and even sample test predictions. You can save experiment files and datasets directly to Weights & Biases or store pointers to your own storage.
import wandb
from transformers import DebertaV2ForQuestionAnswering
# 1. Create a wandb run
run = wandb.init(project=’turkish-qa’)
# 2. Connect to the model checkpoint you want on W&B
wandb_model = run.use_artifact(‘sally/turkish-qa/
deberta-v2:v5′)
# 3. Download the model files to a directory
model_dir = wandb_model.download()
# 4. Load your model
model = DebertaV2ForQuestionAnswering.from_pretrained(model_dir)

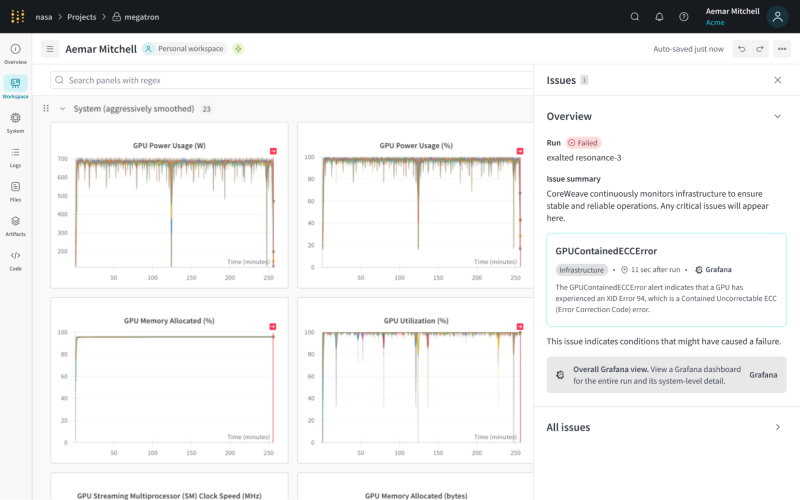
Comprehensive infrastructure observability from CoreWeave
Receive powerful alerts and actionable recommendations from CoreWeave telemetry, directly overlaid on your run metrics plots in W&B Models, allowing you to quickly debug hardware and infrastructure issues during model training and fine-tuning.
Monitor your CPU and GPU usage
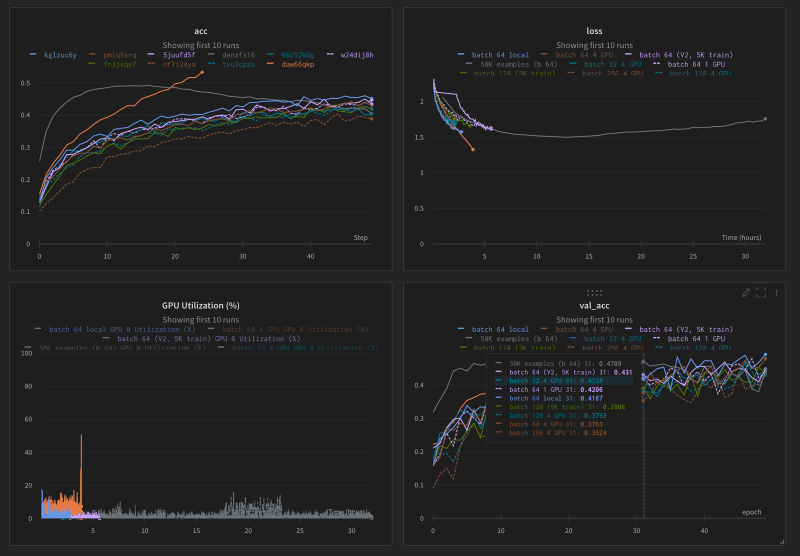
From “When Inception-ResNet-V2 is too slow” by Stacey Svetlichnaya

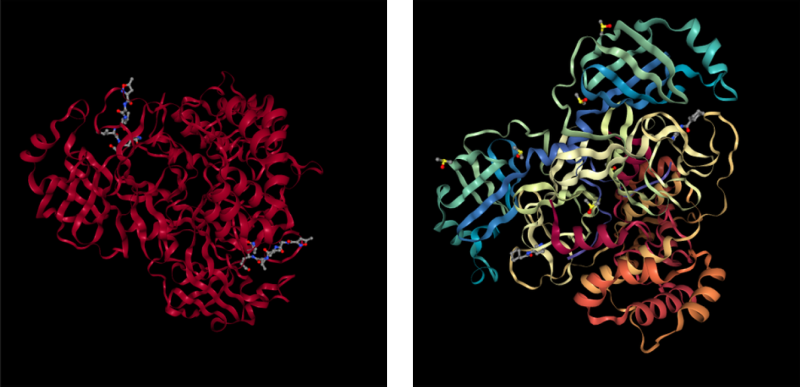
COVID-19 main protease in complex N3 (left) and COVID-19 main protease in complex with Z31792168 (right) from “Visualizing Molecular Structure with Weights & Biases” by Nicholas Bardy
Debug performance in real time
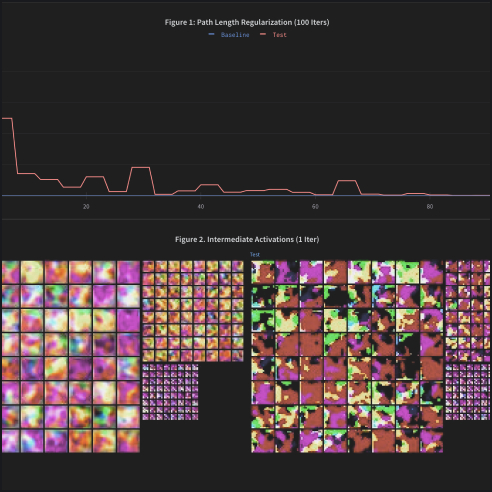
See how your model is performing and identify problem areas during training. We support rich media including images, video, audio, and 3D objects.
Dataset versioning with deduplication 100GB free storage

Explore Weights & Biases
Learn more about W&B Models
The Weights & Biases platform helps you streamline your workflow from end to end
Models
Experiments
Track and visualize your ML experiments
Sweeps
Optimize your hyperparameters
Registry
Publish and share your ML models and datasets
Automations
Trigger workflows automatically
Weave
Traces
Explore and
debug LLMs
Evaluations
Rigorous evaluations of GenAI applications

